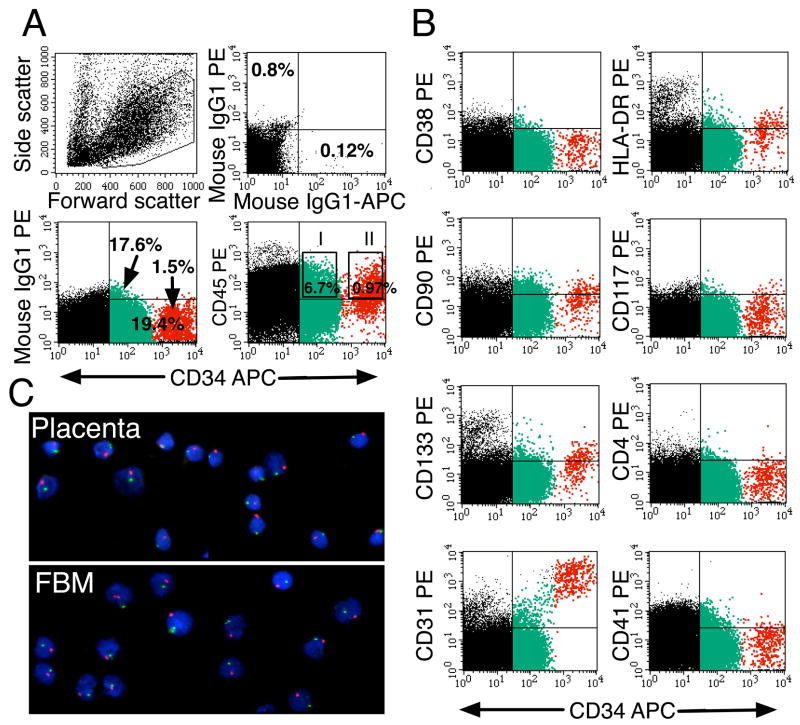
Figure 1.
Phenotypic profile and fetal origin of placental hematopoietic progenitors. In A and B, freshly isolated light-density cell suspension from a 10-week placenta was stained with the indicated mAbs and PI, to identify dead cells. (A) The forward versus side-scatter profile of 105 cells and the electronic gate used to include all hematopoietic cells. Another gate was set to exclude PI+ cells (not shown). Isotype-matched negative controls are included. The gates set for cell sorting experiments used in C and in Figures 6 and 7 are shown in the CD34-APC versus CD45-PE dot plot (I for CD34+CD45low; II for CD34++CD45low). (B) Staining of the same cells with mAbs against markers expressed by hematopoietic progenitors. Multicolor analysis was performed to highlight the CD34++CD45low (red) and CD34+CD45low (green) cells. Results are representative of 12 experiments. (C) Sorted CD34++CD45low cells (using gate II in A) from placenta and from fetal BM (FBM) from the same 19-week specimen were hybridized with fluorescent probes specific for the X (green) or Y (red) chromosomes. Cell nuclei were stained with 4′,6′-diamidino-2-phenylindole (blue). Photomicrographs of the slides at 40x magnification were taken with a Nikon E-800 microscope/camera.

