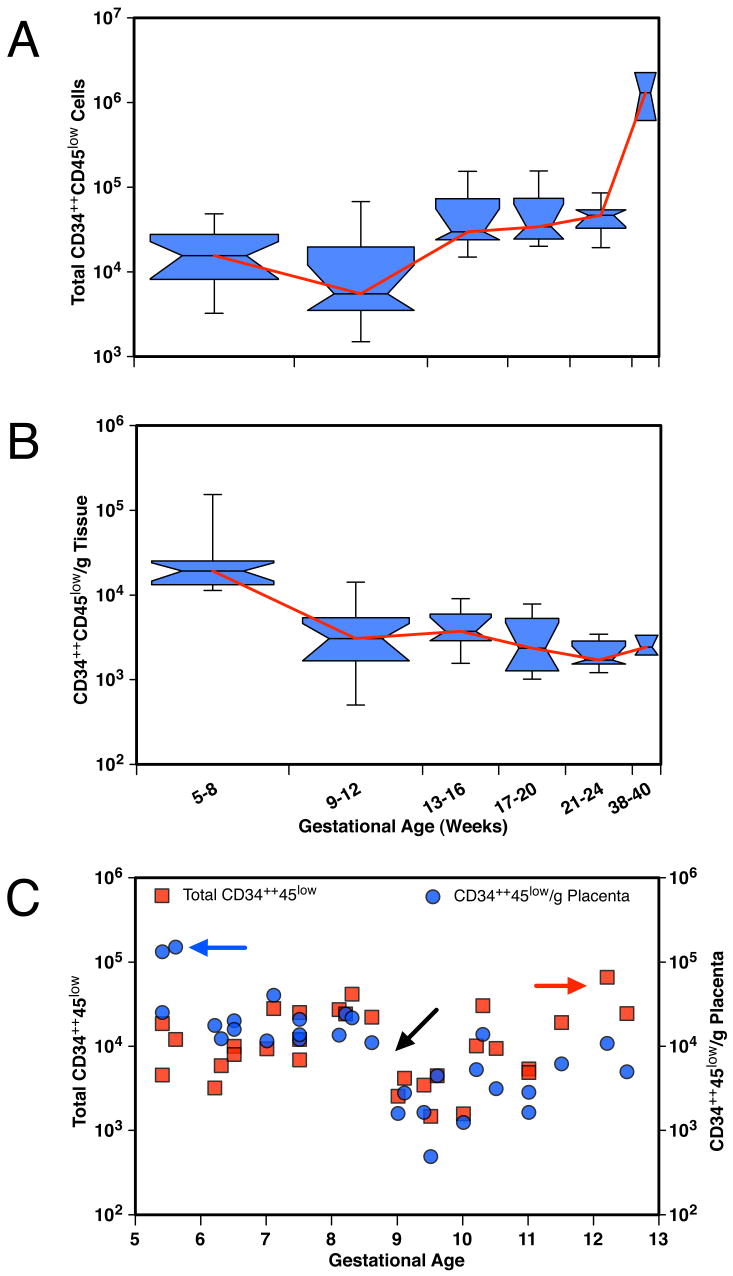
Figure 3.
The hematopoietic compartment of the placenta changes during gestation. (A) Box plot of total CD34++CD45 low placental cells grouped by gestational age (in weeks). (B) Box plot of the number of CD34++CD45low cells per gram of tissue grouped by gestational age. Box plots display the upper and lower quartiles surrounding the median (indicated by the notch), and the span of the whiskers shows the range of the data. Diamonds indicate the position of the mean values. Box width is proportional to sample size (5–8 weeks, n=18; 9–12 weeks, n=15; 13–16 weeks, n=9; 17–20 weeks, n=7; 21–24 weeks, n=7; 38–40 weeks, n=3). (C) Total numbers of CD34++CD45 low placental cells (red squares) and CD34++CD45 low placental cells per gram (blue circles) of individual 5-to 12-week tissues (n = 30). Blue arrow indicates the high number of CD34++CD45 low cells obtained per gram of 5-week tissues. Black arrow indicates the decrease at 9 weeks in total numbers and cells/gram tissue of CD34++CD45 low cells. Red arrow indicates the increase in total CD34++CD45 low placental cells at the end of the first trimester.

