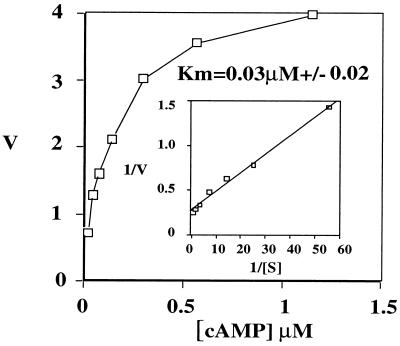
Figure 4.
PDE7B kinetics. The concentration range of cAMP is indicated on the x-axis (μM). On the y-axis, the velocity (V) of cAMP hydrolysis was plotted (pmol/min/ml). (Inset) A Lineweaver–Burk plot of the same set of data. Averages of triplicate determinations in one representative experiment are depicted. The Km of PDE7B for cAMP was determined to be 0.03 μM (±0.02) as represented by the average of nine separate experiments with two independent enzyme preparations.

