Fig. 2.

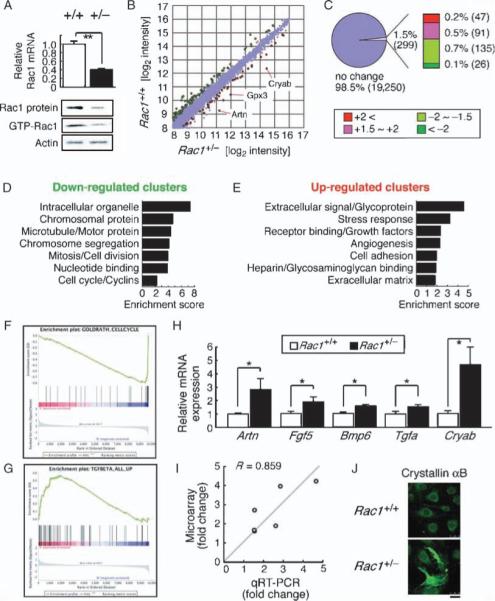
Expression profiling of Rac1+/− ECs. Differential mRNA expression between Rac1+/− and Rac1+/+ mouse ECs was explored by microarray analysis. (A) qRT-PCR, immunoblotting, and GST-PAK (glutathione S-transferase–p21-activated protein kinase) pull-down assays showing Rac1 expression and activity in Rac1+/− and Rac1+/+ ECs. (B and C) The up-regulated (red) and down-regulated (green) genes in Rac1+/− ECs. The scatter plot (B) shows 12,089 gene features with the signal intensity >200. (D and E) Functional annotation clustering of the down-regulated (D) and up-regulated (E) genes. (F and G) GSEA showing enrichment of cell cycle–related genes in Rac1+/+ (F) and TGF-β–inducible genes in Rac1+/− ECs (G). Each plot displays (top) progression of the running enrichment score; (middle) “hits” in the gene set against the ranked list of all genes in the data; (bottom) histogram for the ranked list. (H and I) qRT-PCR (H) and correlation analysis (I) to validate the microarray data. (J) Crystallin αB immunostaining of Rac1+/− versus Rac1+/+ ECs. Scale bar, 25 μm. Values are means ± SEM of three to four replicates (*P < 0.05, **P < 0.01; ANOVA).
