
Fig. 3.
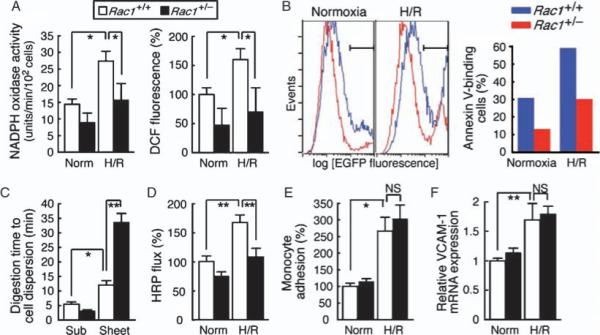
Phenotypic profiling of Rac1+/− ECs. (A, B, D, E, and F) Rac1+/+ and Rac1+/− mouse ECs were sequentially exposed to 4-hour hypoxia and 2-hour (A and D) or 20-hour (B, E, and F) reoxygenation (H/R) or treated with normoxia (Norm). (A) NADPH oxidase activity (left) and ROS production (right) as determined by DPI-inhibitable lucigenin chemiluminescence and DCF fluorescence, respectively. (B) Apoptotic death was assessed by flow cytometry (left) as the Annexin V–EGFP–labeled EC fraction (right). (C)ECs at subconfluence (Sub) or prolonged confluence (>4 weeks) (Sheet) were subjected to standard trypsinization until single-cell suspensions were obtained. (D) The permeability of confluent EC monolayers grown on 0.4-μm Transwell inserts was assessed as HRP leak across the membrane during normoxia and H/R. (E) After exposure to normoxia or H/R, ECs were co-cultured with [3H]thymidine-labeled monocytes (THP-1) for 3 hours. After washing, monocyte-EC binding was assessed as the cell lysate radioactivity. (F) VCAM-1 mRNA abundance was determined by qRT-PCR. (A, C to F) Values are means ± SEM of triplicates (*P < 0.05, **P < 0.01; ANOVA).