
Fig. 4.
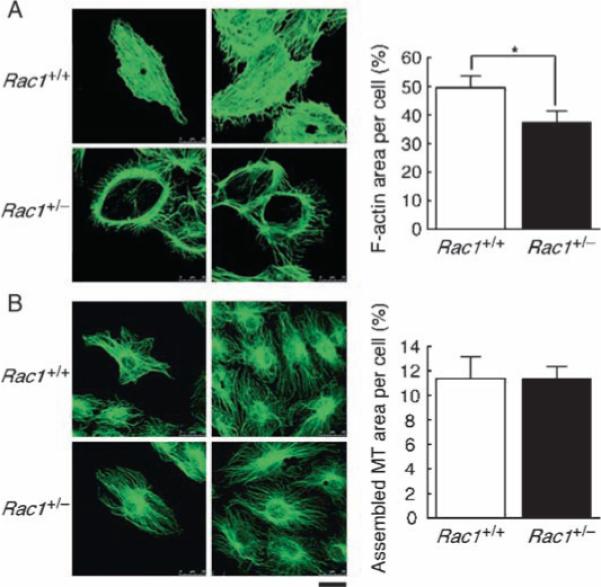
Decreased actin polymerization and circumferential redistribution of F-actin to the cortical areas in Rac1+/− ECs. Mouse ECs cultured in the presence of 20% serum were fixed and stained with (A) phalloidin to visualize F-actin and (B) antibody against β-tubulin for microtubules (MT). The F-actin and MT-labeled areas were quantified and represented as percent of total cell areas. Scale bar, 25 μm. Values are means ± SEM of five to seven replicates (*P < 0.05; ANOVA).