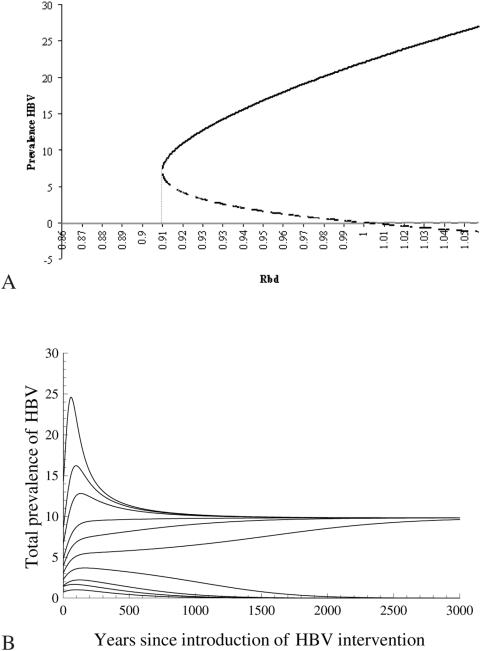
Figure 3. Bistability: coexistence of endemic and disease-free equilibria.
A. Bifurcation diagram. The two positive equilibria are shown with black, the disease-free equilibrium with grey; solid lines correspond to locally asymptotically stable equilibria, dotted lines to unstable equilibria. Results shown here are with  varied from 0.12 to 0.15 (Rbd from 0.86 to 1.05),
  ,
,  , and the other parameters as in Table 1. B. The prevalence of hepatitis B virus (HBV) with different initial conditions. In all curves shown,
  ,
,  ,
,  , and the other parameters as in Table 1. The two positive endemic equilibria are at 9.83 (locally stable) and 4.88 (unstable).

