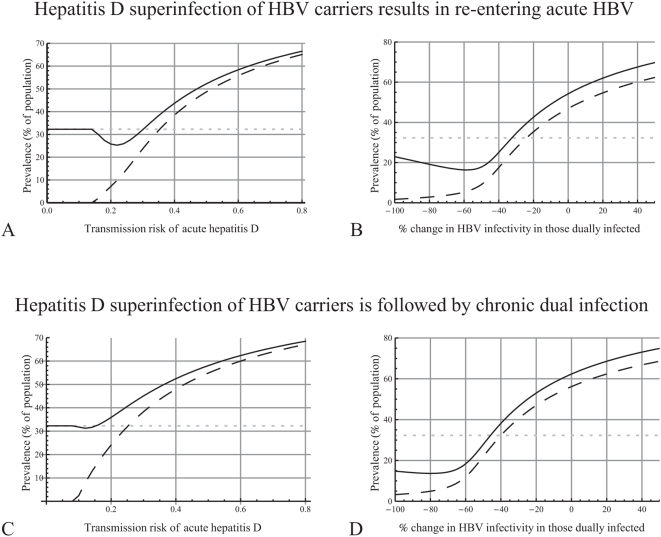
Figure 4. How the characteristics of hepatitis D affect the endemic prevalences of hepatitis B (HBV) and hepatitis D.
The plot shows the prevalences of HBV (solid line) and hepatitis D (dashed line) in a population where both viruses are circulating and the prevalence of HBV in a population where only HBV is circulating (grey dotted line). A. The transmission probability of acute hepatitis D ( ) was varied from 0 to 0.8 and that of chronic hepatitis D (
 )was 0.65 times that of acute hepatitis D. B. The percentage change in HBV infectivity in those dually infected (compared to those with single HBV infection,
  , for j = 1, 2) was varied from −100% to +50%. C, D. As in plots A, B, but assuming that HBV carriers who are superinfected with hepatitis D do not re-enter acute HBV (using equations (2) instead of the last two equations of system (1)).

