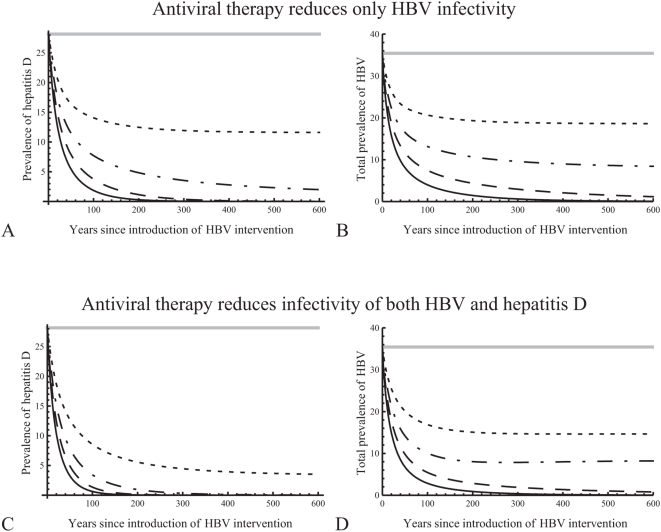
Figure 5. How antiviral treatment reduces the prevalences of hepatitis B (HBV) and hepatitis D in time.
A, B. Treatment reduces only the infectivity of HBV. It is introduced at time 0, after the epidemic had stabilised at the endemic equilibrium with both viruses present, which is shown with a straight grey line. The infectivity of chronic HBV is reduced by 20% (dotted lines), 30% (dashed-dotted lines), 40% (dashed lines), or 50% (solid lines). Prevalences are shown as percentages of total population. C, D. As in plots A, B, but assuming that treatment reduces also the infectivity of hepatitis D, by the same percentage as that of HBV.

