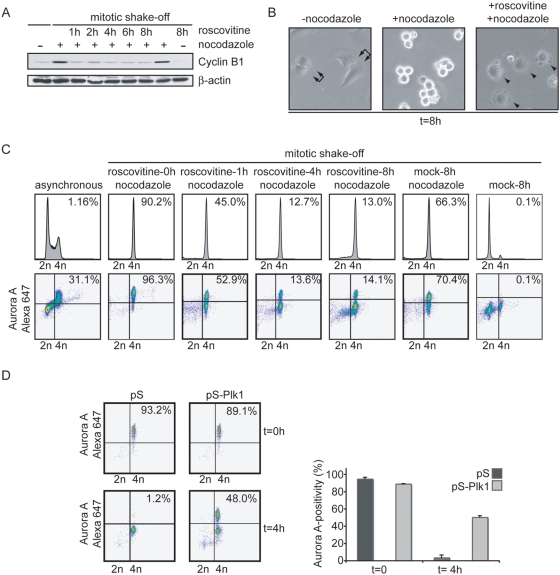
Figure 3. Aurora A degradation during synchronized mitotic exit.
A, B, C U2OS cells were treated with nocodazole for 16 hours. Mitotic cells were collected by mitotic shake off and left untreated or treated with Roscovitine. At indicated time points after Roscovitine addition, cell lysates were obtained (A), DIC images were takes (B) or cells were fixed in ethanol for FACS analysis (C). Cell lysates were analyzed by Western blotting using anti-Cyclin B1 and anti-β-Actin (A). In parallel, cells were co-stained with anti-Aurora A-Alexa 674 and anti-MPM-2-Alexa 488 and analyzed by FACS. MPM2-positivity of 1*104 events is indicated in upper-right corner of DNA profile histograms. Aurora A-positivity is indicated in upper right corner of Aurora A plots. D. U2OS cells were transfected with pS or pS-Plk1 in combination with GFP-spectrin. 36 h after transfection, nocodazole was added to cell cultures. After 16 h, mitotic cells were collected by shake-off. Mitotic cells were replated in the absence or presence of Roscovitine for 4 h, and subsequently cell were fixed in ethanol and stained with anti-Aurora A-Alexa-647. Representative Aurora A-plots of GFP-positive cells are shown (left panel) and the mean and SEM of 3 experiments are plotted (right panel).

