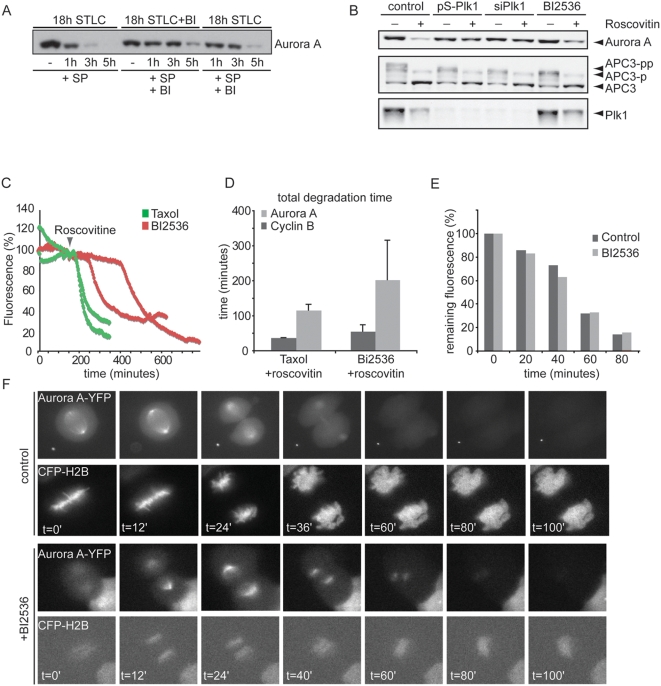
Figure 4. Plk1 activity is required to control Aurora A levels during mitotic exit.
A. Cells were synchronized by treatment with 20 µM STLC for 18 h in the presence (BI) or absence of 20 nM BI 2536. Mitotic cells were then harvested by mitotic shake-off. Cells were replated in medium with STLC, BI2536 and immediately induced to exit from mitosis by addition of the Mps1 inhibitor SP600125, either alone (lanes 1–4) or in combination with 20 nM BI 2536 (lanes 5–8). Addition of BI2536 after release of the spindle checkpoint was insufficient to stabilize Aurora A to the same extent (Fig 4A, lane 9–12). At the indicated time-points samples were prepared in sample buffer and analyzed on Western blots with the indicated antibodies. B. U2OS cells were co-transfected with 1 µg pBabepuro vector and either 10 µg pS or pS-Plk1 vectors (and selected) or tranfected with a si-RNAi pool targeting Plk1. Cell were thymidine released and subsequently arrested in mitosis by adding Nocodazole to pS transfected cells, BI2536 to untreated cells, or intrinsically by Plk1-RNAi. Mitotic cells were collected by mitotic shake off. Half of the mitotic cells were replated in the presence of Roscovitin to force cells into G1 (lanes with +), the other half of the mitotic cells were also replated but kept in mitosis (pS mitotic cells with nocodazole, pS-Plk1 mitotic cells intrinsically and untreated cells with BI 2536, lanes with −). Cells were collected after 1 hour, lysed and protein levels were measured. Whole cell extracts were probed for APC3, Aurora A and Plk1. C, D U2OS cells were transfected with 0.1 µg Aurora A-YFP A and 0.1 µg Cyclin B1-Cherry. Following release form a thymidine block cells were incubated with taxol or BI2536. Roscovitin was added to induce mitotic exit and fluorescence images were obtained at indicated timepoints. In Plk1-depleted cells, onset of Aurora A destruction was first delayed and slow when mitotic exit was visible. D. Averages and standard deviations of total degradation times for Cyclin B and Aurora A were plotted (12 cells). E. U2OS cells transfected with Aurora A-YFP A and H2B-CFP were treated with or without BI2536 after chromosome alignment was completed. YFP levels during mitotic progression were measured. F. Graphs show quantification of representative images of YFP fluorescence from metaphase to the next G1 in cells treated with or without BI2536.

