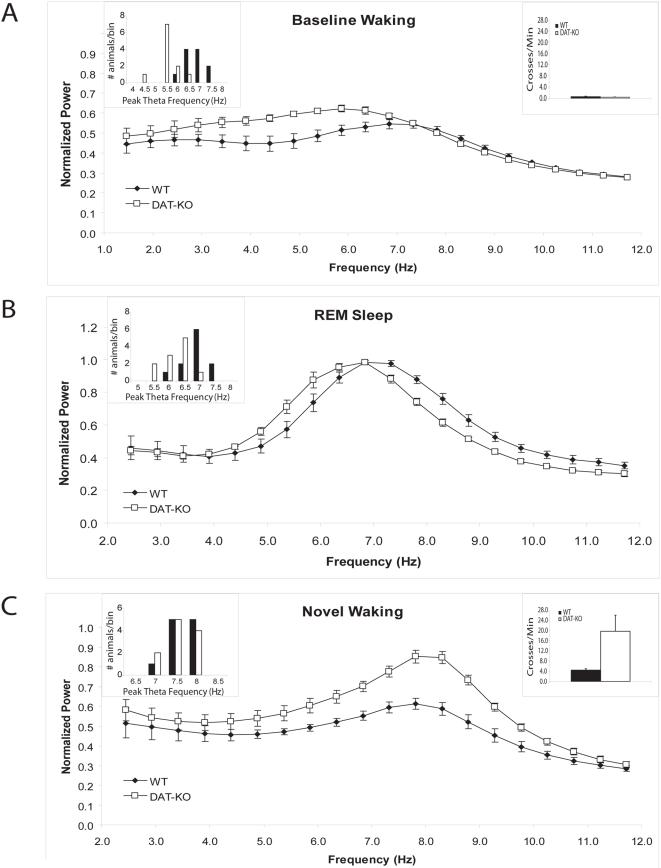
Figure 1. Altered HTOs in hyperdopaminergic mice.
Mean hippocampal LFP power distributions were calculated in the 2–12 Hz range for each mouse across the behavioral periods of interest. The images depict normalized power spectral distributions averaged across animals within genotype. Two way ANOVA of HTO frequency found the main effects of genotype [F1,49 = 21.66, p<0.01] and condition [F4,49 = 82.82, p<0.01], as well as the genotype by condition interaction [F4,49 = 9.96, p<0.01] to be significant. Post-hoc tests revealed that DAT-KO mice display lower hippocampal theta oscillation (HTO) frequencies than WT mice during (A) baseline waking (p<0.01) and (B) REM sleep periods (p = 0.011), but not (C) waking periods immediately following novelty exposure (p = 0.35). Locomotor activity measured during the A) habituated and C) novelty exposed waking states are depicted in insets, and behavioral statistics are shown in Fig. 2F. One way ANOVA found significant effects when mice were exposed to a novel environment for both DAT-KO [F4,24 = 54.47, p<0.01] and WT mice [F4,24 = 31.19, p<0.001]. Newman-Keuls tests showed that peak HTO frequencies increased with novelty exposure for both genotypes (DAT-KO: N-K20 = 3.92, WT: N-K20 = 2.35). Error bars represent S.E.M for normalized theta power determined for each frequency across animals within a genotype; n = 11 for both genotypes. Two way ANOVA of total theta power found the main effects of genotype [F1,39 = 15.21, p<0.01] and condition [F3,39 = 4.55, p<0.01], as well as the genotype by wake-state interaction [F3,39 = 6.46, p<0.01] to be significant. Post-hoc tests revealed that total theta power was not different between DAT-KO and WT mice during the baseline waking period (p>0.1); however, it was significantly higher in DAT-KO mice than WT mice following novelty exposure (p<0.01). One way ANOVA's found significant effects of condition for DAT-KO [F3,19 = 8.22, p<0.01] but not WT mice [F3,19 = 2.05, p>0.05]. Newman-Keuls tests showed that novelty exposure increased total theta power in DAT-KO (N-K10 = 4.66).

