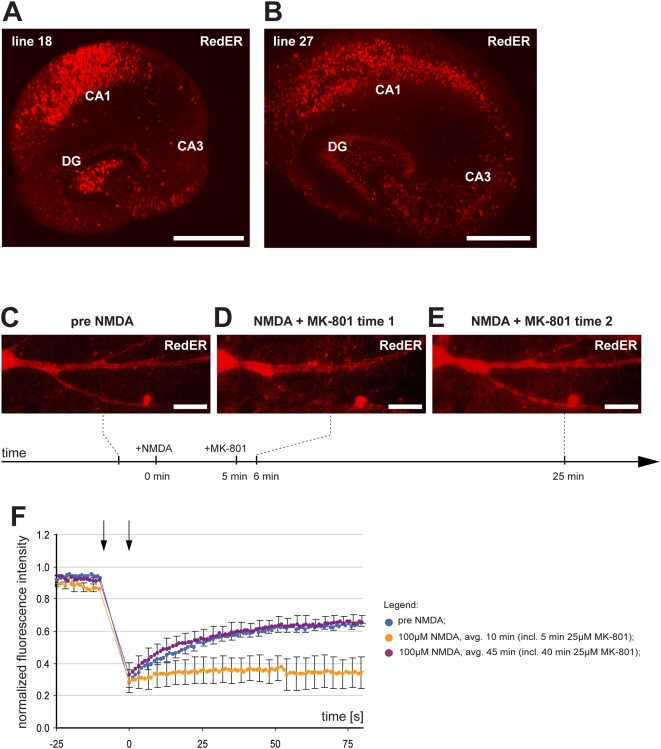
Figure 4. Reversible ER fission in organotypic slices.
(A) Hippocampal expression of RedER in Thy1-RedER transgenic mouse line 18. (B) RedER expression in line 27. The expression pattern of the transgene differs slightly in that line 18 has no expression in pyramidal cells of CA3 but does express at high level in the hilus. (C) Representative images of dendritic ER structure in a CA3 pyramidal cell from line 27 with continuous ER prior to any treatment. (D) 100 µM NMDA triggered rapid ER fission. (E) 25 µM MK-801 led to fusion within 25 min. (F) Normalized average FRAP signal over time in untreated neurons (blue), the same neurons after NMDA for 10 min (orange) (note that MK-801 was added after 5 min) and after MK-801 (purple). Photobleaching was performed between the arrows. Time = 0 was set to when photobleaching ends and fluorescence starts to recover. Error bars are SEM. n = 4 neurons in 4 slices. Scale bars: 500 µm in A and B, 10 µm in C-E. avg.: average.

