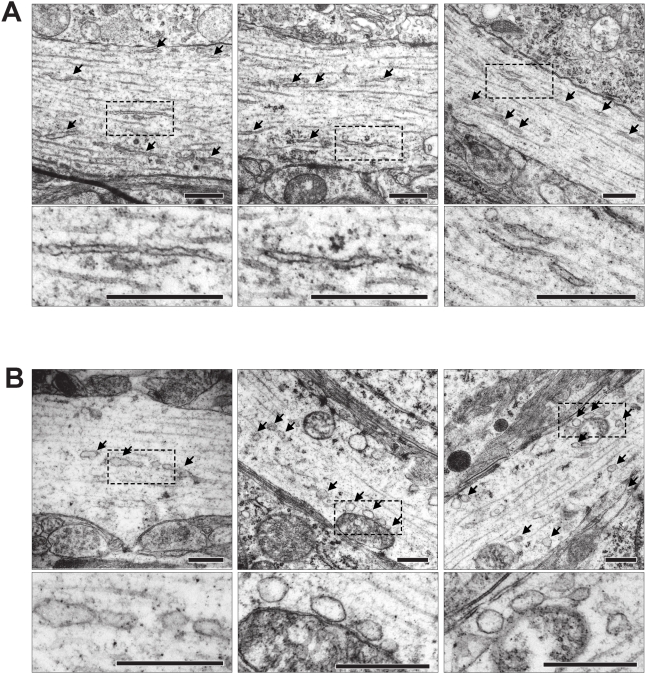
Figure 5. EM analysis of SER in dendrites.
(A) Three representative images of dendrites from CA1 and CA3 in organotypic slices. ER profiles are indicated by arrows. (B) The ultrastructure after 100 µM glutamate for 5 min before fixing. No normal SER profiles were seen; instead the dendritic cytosol contains numerous dilated vesicles indicated by arrows. Boxed areas in the low magnification panel are enlarged below. Scale bar in all panels 500 nm.

