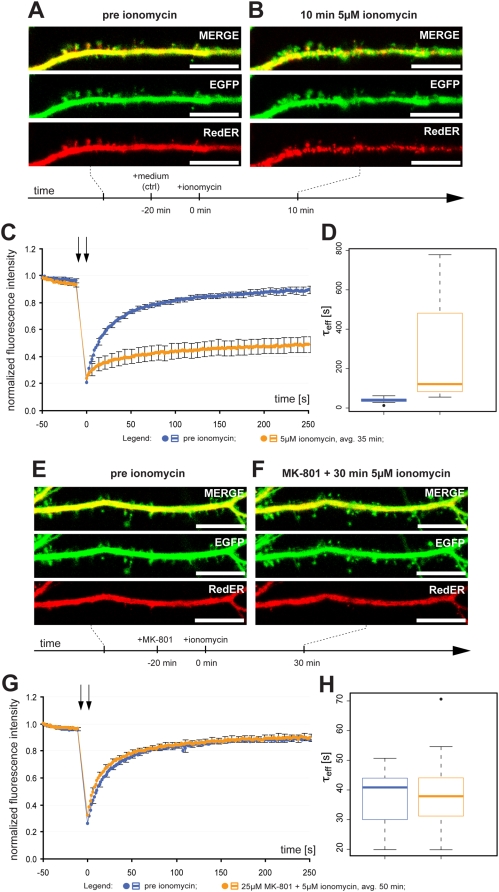
Figure 8. Ionomycin triggers NMDA receptor-mediated ER fission.
(A) Representative image of a dendrite from a neuron with normal dendritic and ER structure. (B) Treatment with 5 µM ionomycin for 10 min caused ER fission along with a pronounced effect on gross dendritic structure (dendritic blebbing). (C) Normalized average FRAP signal over time in untreated neurons (blue) and the same neurons after ionomycin for an average of 35 min (orange). Photobleaching was performed between the arrows. Time = 0 was set to when photobleaching ends and fluorescence starts to recover. Error bars are SEM. n = 18. (D) Box plot of τeff values in untreated neurons (blue) and the same neurons after ionomycin (orange). The line in the box is the median and the box represents the 25–75 percentiles. Whiskers extend to the extreme values as long as they are within a range of 1.5× box length. (E) Representative image of a dendrite from a neuron with normal dendritic and ER structure. (F) Treatment with 25 µM MK-801 for 20 min prior to 5 µM ionomycin prevented ER fission and only caused minor effects on gross dendritic structure. (G) Normalized average FRAP signal over time in untreated neurons (blue) and the same neurons after MK-801 and ionomycin for an average of 50 min (orange). Photobleaching was performed between the arrows. Time = 0 was set to when photobleaching ends and fluorescence starts to recover. Error bars are SEM. n = 18. (H) Box plot of τeff values in untreated neurons (blue) and the same neurons after ionomycin (orange). The line in the box is the median and the box represents the 25–75 percentiles. Whiskers extend to the extreme values as long as they are within a range of 1.5× box length. One neuron was outside this range and plotted as an outlier. Scale bar in all panels: 10 µm. avg.: average.

