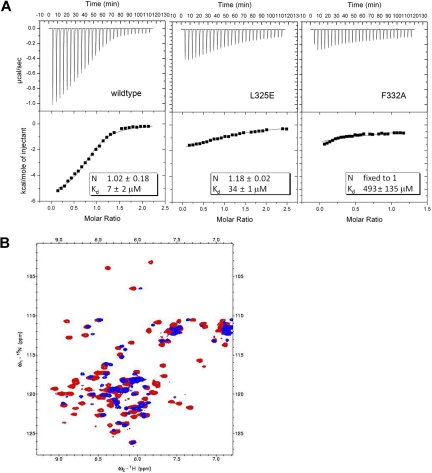
Figure 3.
eTAFH mutations impair HEB binding. (A) ITC measurements of the binding of HEB peptide to wild-type and mutant eTAFH domains. In each panel, the top portion is the raw data, and the bottom portion is a plot of the binding corrected for dilution enthalpy (squares indicate experimental data; line, fit to a one-site binding model). The average N (stoichiometry) and Kd from 2 independent experiments (± SD) for each protein are shown in the box. The stoichiometry was fixed to 1 to fit the F332A mutant data. (B) Overlay of 15N-1H HSQC spectra of wild-type eTAFH domain (red) and the F277A mutant (blue). Most peaks in the F277A mutant are absent or shifted, indicating the structure is disrupted.

