Fig. 4.
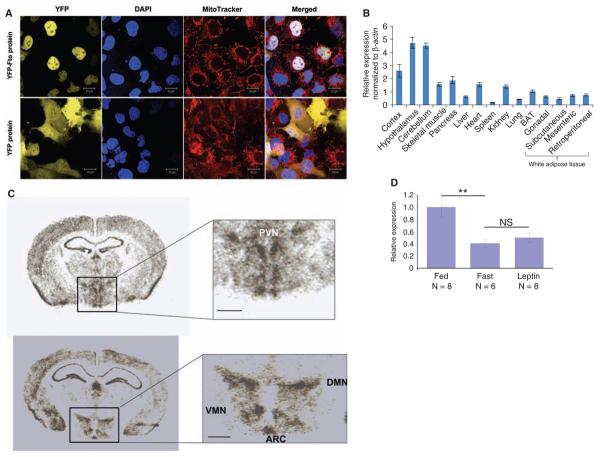
Expression studies of Fto protein and mRNA in mice. (A) Subcellular localization of murine Fto in COS-7 cells. Confocal fluorescence images of COS-7 cells expressing YFP-Fto or YFP show YFP-Fto localizing to the nucleus. Nuclei were visualized with 4′,6-diamidino-2-phenylindole (DAPI) staining and mitochondria with MitoTracker. Colocalization of YFP (yellow) and DAPI (blue) in the merged images produces a white signal. (B) Relative expression of Fto mRNA in different tissues. Bar graphs show the relative expression of Fto mRNA normalized to β actin across a panel of different tissues. Data are represented as the mean (±SE) of six independent mice per tissue. (C) In situ hybridization of murine Fto in brain. PVN, paraventricular nucleus; VMN, ventromedial nucleus; DMN, dorsomedial nucleus; ARC, arcuate nucleus; scale bar = 500 μm. (D) Nutritional regulation of Fto mRNA expression in ARC. Bar graphs show the change in expression of Fto mRNA in the arcuate nucleus of the hypothalamus in the fed, fasted, and leptin-treated-while-fasted state. Response is expressed in terms of fold induction of the fasted and leptin-treated expression over the fed expression. The P value was calculated using a two-tailed distribution unpaired Student's t test. **P < 0.01. Data are represented as the mean (±SE) of at least six independent mice per group.

