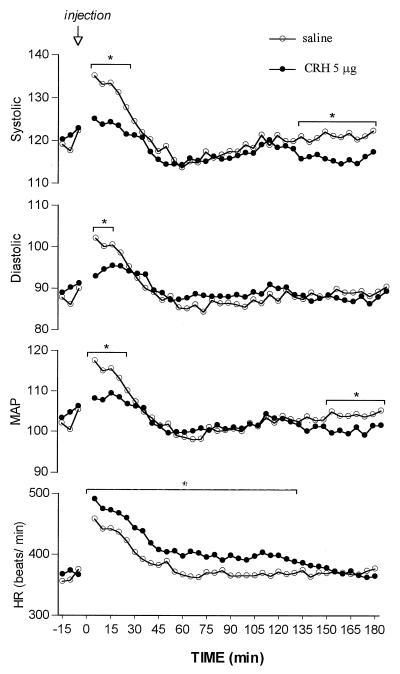
Figure 7.
Continuous recordings of systolic, diastolic, and mean arterial blood pressure and heart rate over 3 hr after CRH injection. The pooled values of 5-min recordings were plotted for the graph. The mean values of six animals in each group are shown. The error bars were eliminated because they were almost the same size as the symbols; *, P < 0.02.

