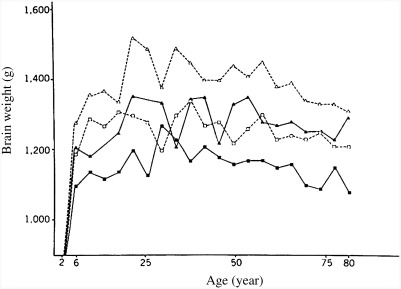
Figure 1.
Mean brain weight for 4-year age periods in various subgroups. Brain weight is plotted at midpoint of each age period (e.g., the point at age 6 years represents the average for subjects between 4 and 8 years; White men, open triangles; Black men, solid triangles; White women, open squares; Black women, solid squares). Differences in brain weights among various groups become apparent at age 6 years. (From Ho et al., 1980, p. 636, Figure 2.)

