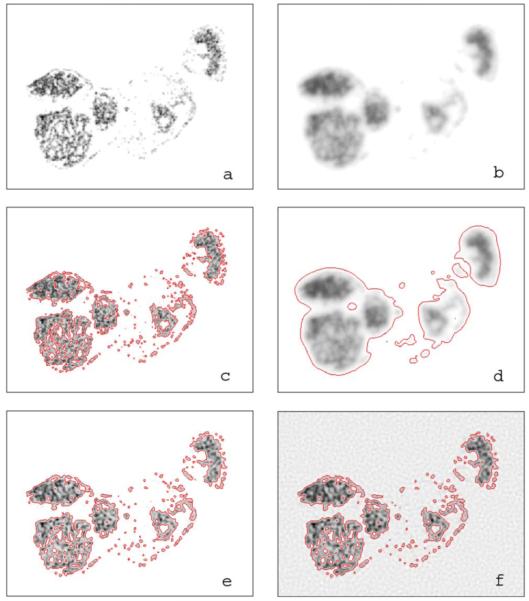
Fig. 4.
The effect of image blurring by the point spread function of 125I and the effect of noise in image recovery using the R-L deconvolution algorithm. Image size is 320 pixel×240 pixel. (a) The original pseudo image of radiotracer distribution. (b) The pseudoautoradiographic image blurred with the PSF of 125I. (c) The pseudoimage with contours of arbitrary marker-positive threshold enclosing 95% of overall intensity. (d) The blurred image with contours of 95% total intensity threshold. (e) and (f) Blurred images generated from the pseudoimage in panel (a) by adding a background of 0.01 and 5.0 plus arbitrary noise restored through 67 and 45 deconvlucy iterations, respectively. Contours set at the 95% total intensity threshold have been plotted in each of the restored images.

