
Figure 2.
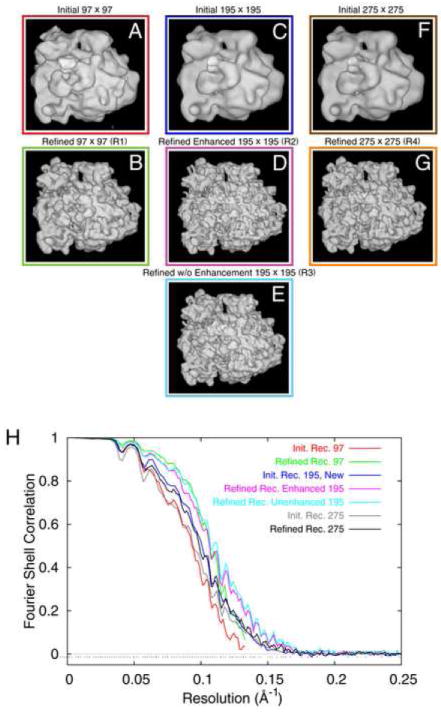
Reconstructions from a 52,000-particle test dataset, (A,B) initial and refined reconstruction, with arrays 2x decimated; (C,D) initial and refined reconstruction from the non-decimated data; (E) same as (D), except that amplitude enhancement was used in each step of the refinement; (F,G) same as (C,D) but with window size enlarged from 195 × 195 to 275 × 275. (H) FSC curves for (A-G), color-coded to match color surrounding each reconstruction.