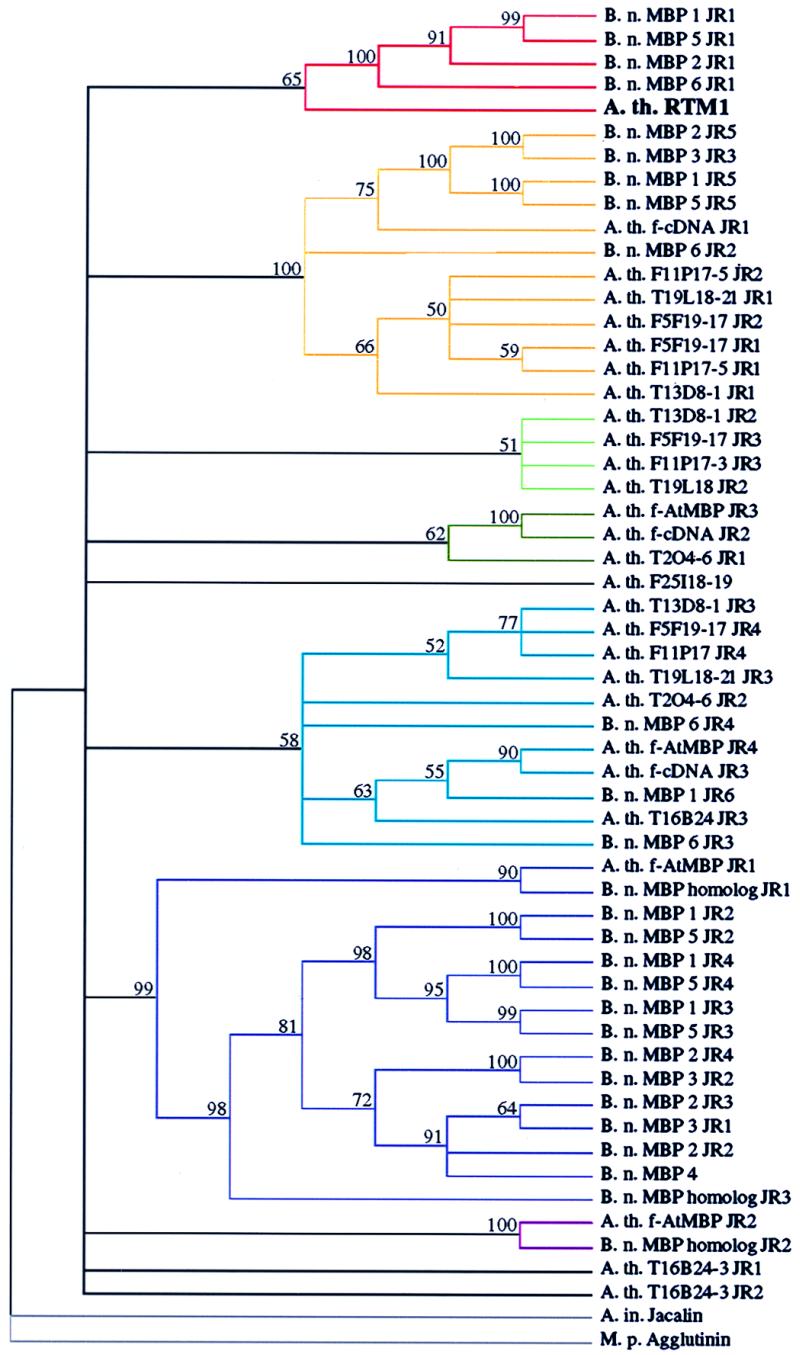
Figure 5.

Cladistic analysis of JRs from various proteins. Repeats were aligned and assembled into a single tree by a heuristic search using bootstrap analysis (100 replicates) with simple sequence addition, tree-bisection-reconnection branch swapping, steepest descent off, and mulpars on using paupsearch and paupdisplay. Jacalin and M. pomifera agglutinin were assigned to the outgroup. Numbers above branches are bootstrap percentage values. The relative positions of JRs in proteins containing multiple repeats are indicated (e.g., JR1, JR2). Colored lines highlight each clade. For abbreviations, see Fig. 4 legend.
