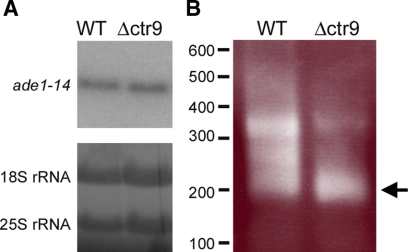
Figure 8.
Δctr9 alters the 3′ processing of the ade1-14 transcript. (A) Northern analysis of ade1-14 transcript levels are shown (top). Equal amounts of total RNA was loaded on the gel, and this was visualized by methylene blue staining of 18S and 25S rRNA (bottom). One representative blot is shown. (B) 3′ RACE analysis of total RNA isolated from wild-type (WT) and Δctr9 strains. The ade1-14 transcript has multiple isoforms in the WT and Δctr9 strain. Arrow indicates the predominant isoform that accumulates in the Δctr9 strain. The molecular-weight marker in base pairs is indicated on the left side of the gel.

