Figure 3.
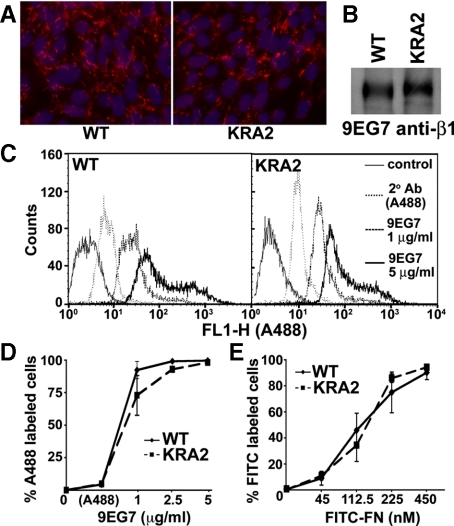
β1 integrin expression and integrin affinity for FN are similar in WT and KRA2 fibroblasts. (A) Live-cell immunolabeling the surface of WT and KRA2 cells with β1 integrin antibodies (red, extracellular β1 integrin; blue, Hoechst staining for nuclei). (B) Cell surface expression of β1 integrin in WT and KRA2 cells determined after biotinylation, immunoprecipitation with 9EG7 anti-β1 antibodies, and immunoblotting the immune complex with streptavidin-HRP. (C and D) Cell surface expression of β1 integrin in WT and KRA2 cells determined by flow-cytometry analysis using the indicated concentrations of anti-β1 9EG7 antibodies. Secondary antibody (A488) alone was used to show nonspecific binding. (E) Binding of FITC-FN determined by flow-cytometry analysis indicates no difference between WT and KRA2 cells at each of the indicated concentrations of FN (p > 0.1; n = 3). Data are means ± SEM of three separate binding assays.

