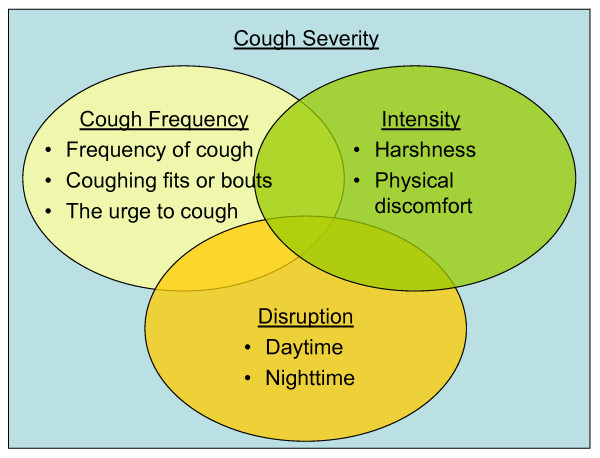
Figure 1.
Conceptual Diagram. Non-proportional Venn Diagram depicting the interrelationships between the concepts that make up total cough severity including cough frequency, cough intensity, and disruption caused by cough. Overlapping areas are non-proportional and do not represent statistical magnitude of relationships between content domains.

