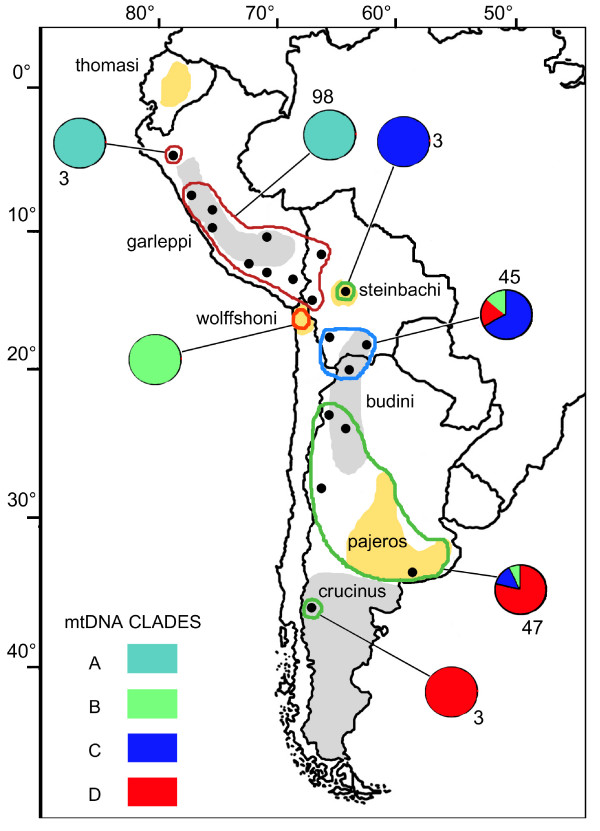
Figure 8.
Distribution of the seven Management Units (MUs) proposed for the pampas cat in the Andean and Argentinean pampas regions, as defined by mtDNA and microsatellite analysis. The proportion of the mtDNA clades and the sample size are shown for each MU. MUs that are encircled with the same colour presented differences in only mitochondrial or nuclear markers, and those with only 3 individuals sampled are proposed as provisional. The MU without indicated sample size was proposed on the basis of Napolitano et al (2008) mtDNA results. The grey and yellow areas refer to the approximate distribution of the pampas cat subspecies mentioned in this research, and their names are indicated. Dots correspond to the sampled localities.

