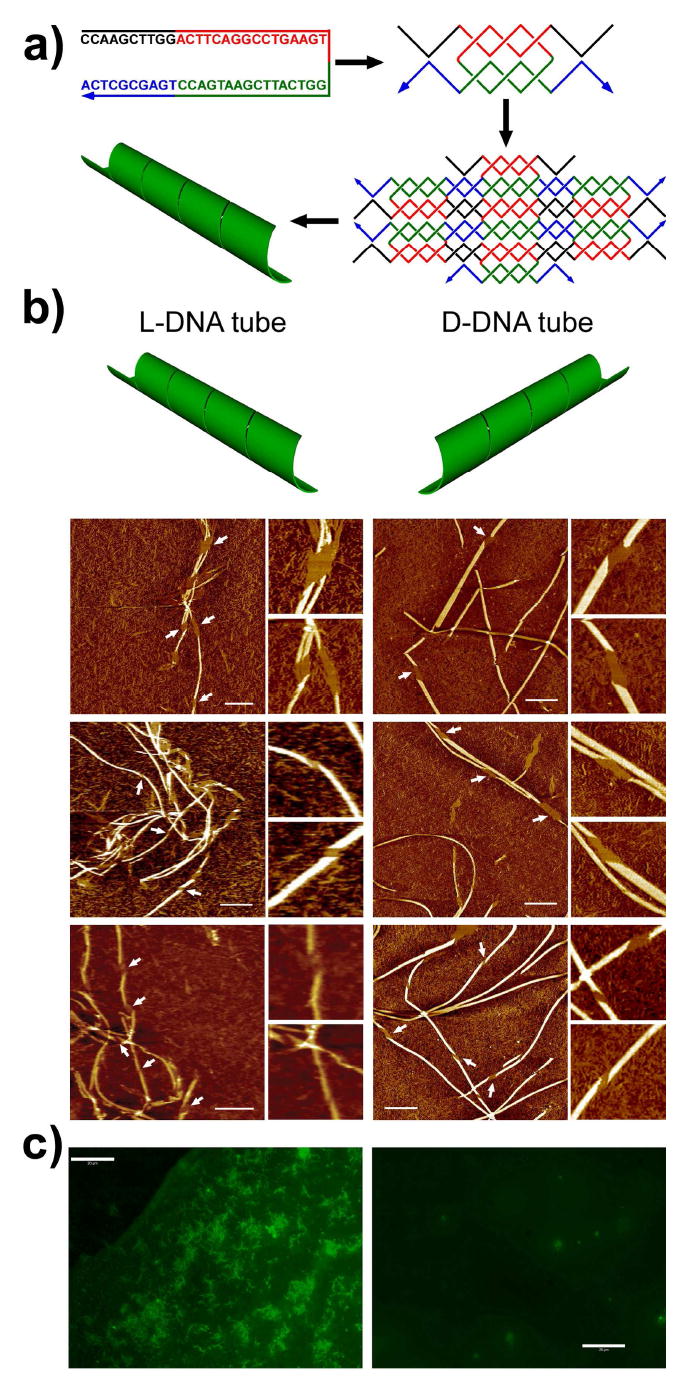
Figure 2.

Self-assembly and characterization of L-DNA nanotubes and in comparison to D-DNA nanotubes. a) Assembly scheme. b) The opposite chirality of the L- (left-column) and D-(right column) DNA nanotubes revealed by the defects (pointed out by the arrow heads) on the tubes observed under AFM. Scale bar: 500 nm. Zoom-in images are 500×500 nm2. c) Fluorescence microscope images showing DNA nanotubes after exonuclease treatment. L-DNA tubes (left) persisted integrity while the D-DNA tubes (right) were digested. Scale bar: 20 μm.
