
Figure 5. Broad deregulation of self-renewal and extracellular signaling pathway genes in junB-deficient LT-HSCs.
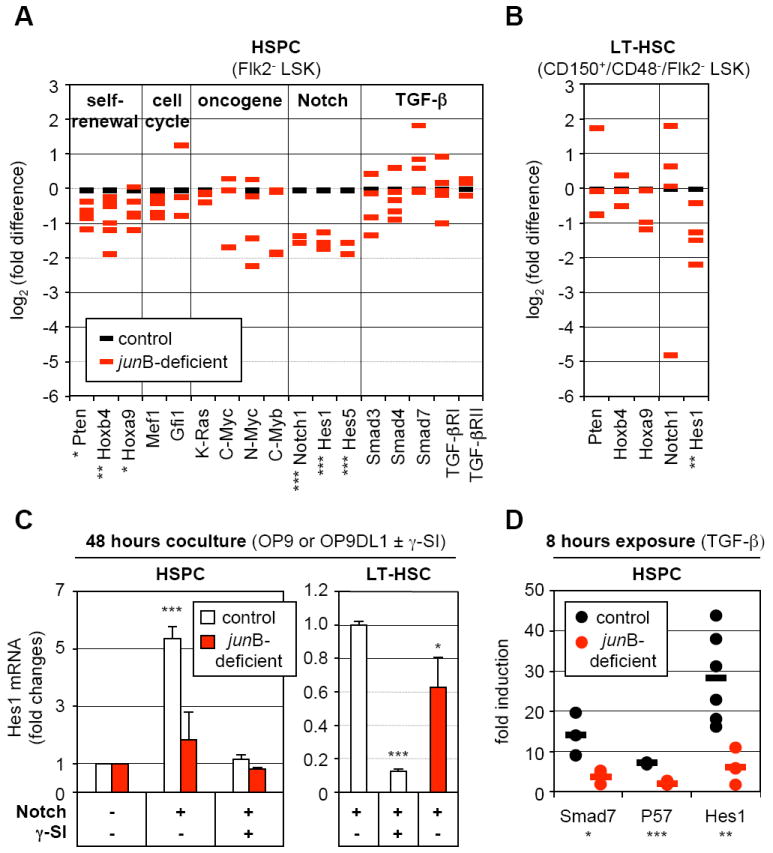
(A) Quantitative RT-PCR analysis of the expression levels of genes and pathways controlling HSC fate decisions in control and junB-deficient HSPCs. The same cDNA samples as in Figure 2C were used for this analysis (*p ≤ 0.05; **p ≤ 0.01; ***p ≤ 0.001).
(B) Quantitative RT-PCR analysis of control and junB-deficient LT-HSCs. The same cDNA samples as in Figure 4B were used for this analysis (*p ≤ 0.05; **p ≤ 0.01).
(C) Control or junB-deficient HSPCs or LT-HSCs (3,000 cells per well) were directly sorted into 96-wells plates containing either OP9 (Notch -) or OP9DL1 (Notch +) cells and incubated for 48 hours with or without γ-secretase inhibitor (γ-SI; 10 μM). The data shown for each population are the averages ± SD of two independent experiments each performed in triplicate. HSPC results are expressed as fold increase compared to Hes1 levels in control or junB-deficient cells cocultured on OP9 cells without γ-SI (arbitrary set to 1). LT-HSC results are expressed as fold decreased compared to Hes1 levels in control cells cocultured on OP9DL1 cells without γ-SI (arbitrary set to 1) (*p ≤ 0.05; ***p ≤ 0.001; β-actin normalization).
(D) Control or junB-deficient HSPCs (3,000 to 20,000 cells per well) were directly sorted into a 96-wells plate, rested overnight and stimulated with 5 ng/ml TGF-β for 8 hours. The results are expressed as fold increase compared to Smad7, Hes1 and p57 levels found in non-stimulated HSPCs incubated for the same length of time. Independent measurements (each performed in triplicate) from 3 to 6 experiments and averages (bars) are shown (*p ≤ 0.05; **p ≤ 0.01; ***p ≤ 0.001; RL-19 normalization).