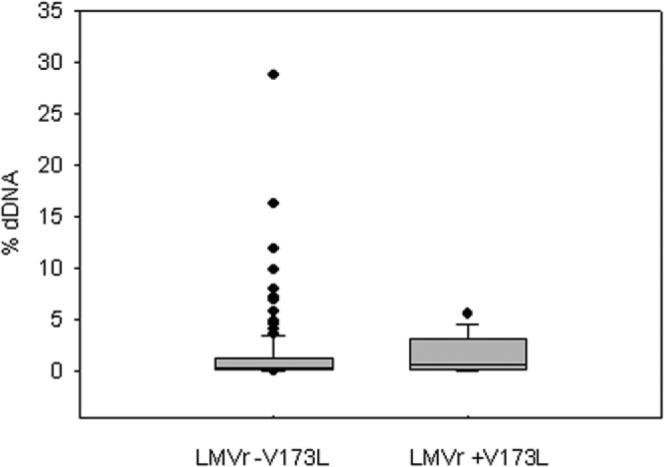
Fig. 3.

Box and whisker plot of % dDNA (y axis) distributions for all LMVr samples without the rtV173L mutation compared with a population of LMVr samples with the rtV173L compensatory mutation. The horizontal line inside the box represents the median values, with the box enclosing values between the 25% percentile value and the 75% percentile value. Error bars enclose 90% of values, and dot points represent outliers beyond the 90th percentile.
