
Figure 1.
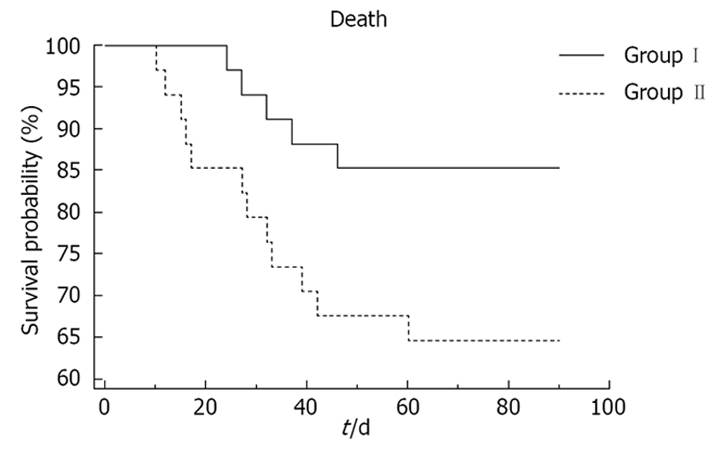
Survival curves (Kaplan-Meier life table analysis) of patients receiving pentoxifylline (group I) as compared to patients receiving prednisolone (group II), at the end of 3 mo of therapy.
Official websites use .gov
A
.gov website belongs to an official
government organization in the United States.
Secure .gov websites use HTTPS
A lock (
) or https:// means you've safely
connected to the .gov website. Share sensitive
information only on official, secure websites.
Survival curves (Kaplan-Meier life table analysis) of patients receiving pentoxifylline (group I) as compared to patients receiving prednisolone (group II), at the end of 3 mo of therapy.