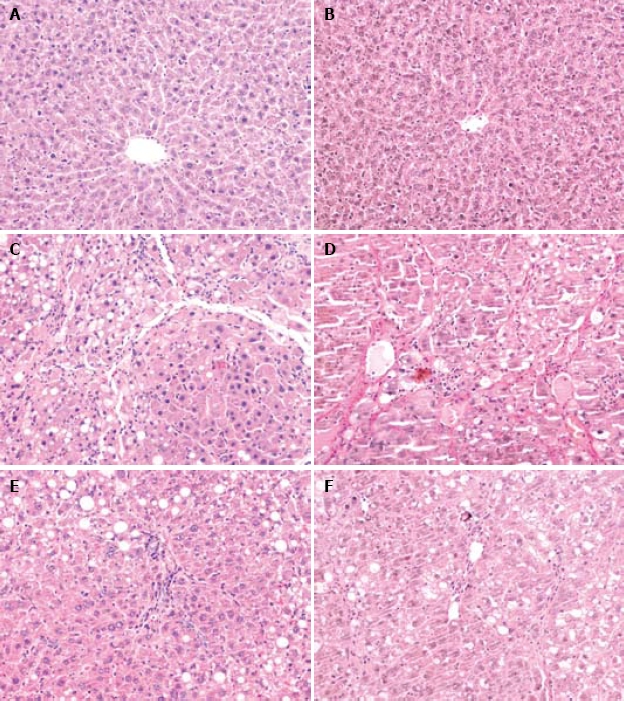
Figure 1.

Pathological changes. Light microscopy of liver tissue sections showing normal liver lobular architecture with central veins in the normal control group (HE staining, × 200) (A), no collagen deposition in liver of normal control group (VG staining, × 200) (B), degenerated and necrotic liver cells associated with inflammatory cells in model group (HE staining, × 200) (C), formation of fibrotic septa in model group (VG staining, × 200) (D), and pathological change in liver of CCl4 + melatonin (10 mg/kg) group was rather milder compared with the model group (HE staining, × 200; VG staining, × 200) (E, F).
