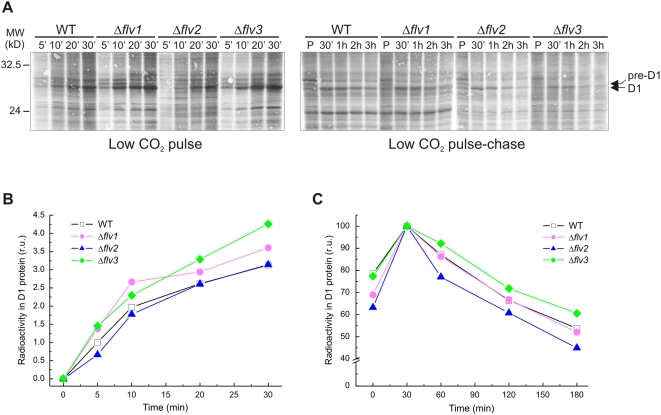
Figure 6. D1 turnover rates of WT and Δflv mutants under LC conditions.
Synechocystis cells were grown under LC and 50 µmol photons m−2 s−1. A radioactive pulse was given to the cell suspension for 5, 10, 20, and 30 min under 150 µmol photons m−2 s−1 illumination. Chase experiments were performed under similar conditions for 0.5, 1, 2, and 3 h. (A) Autoradiogram of the membrane proteins separated by SDS-PAGE. The bands corresponding to the D1 and pre-D1 proteins are indicated by arrows. (B) Quantification of radioactivity in the D1 protein during pulse. (C) Quantification of radioactivity in the D1 protein during chase. Values are the mean of two independent experiments.

