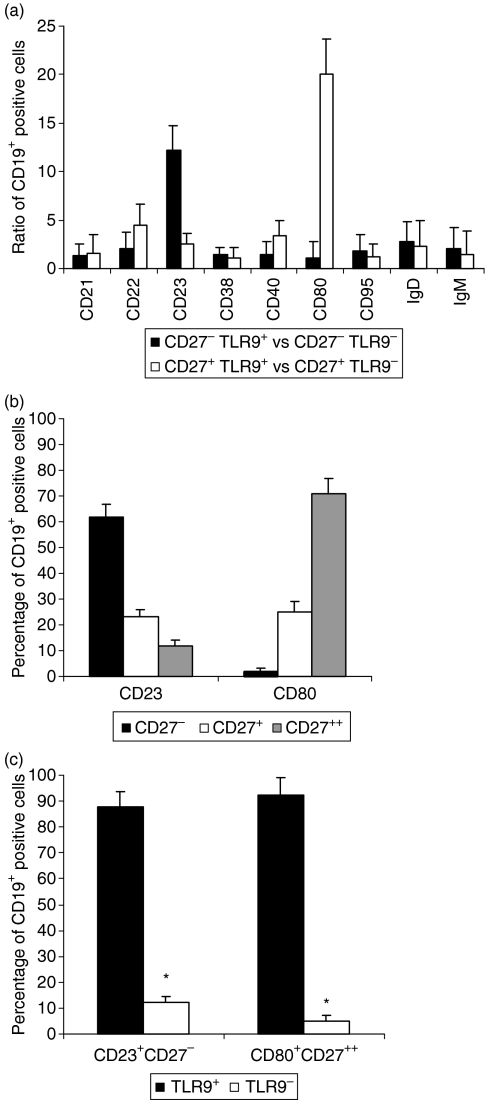
Figure 2.
Flow cytometry analysis of cell surface marker expression by the CD19+ B-cell subpopulation. (a) Cell surface marker associations with Toll-like receptor 9 (TLR9) expression. Ratios of TLR9 expression : non-expression on purified B-cell subsets, including the ratio of CD27− TLR9+ to CD27− TLR9− and the ratio of CD27+ TLR9+ to CD27+ TLR9− (ratios of means ± SD; n = 10), are shown in conjunction with various cell surface markers. (b) Peripheral blood mononuclear cells (PBMCs) were distinguished according to CD23 or CD80 expression. The percentages of low (−), medium (+), and high (++) levels of CD27 expression are shown after gating for CD19+ (mean ± SD; n = 10). (c) PBMCs were distinguished according to CD27 and either CD80 or CD23 expression. The percentage of TLR9-labelled cells is shown after gating for CD19+ (mean ± SD; n = 10).

