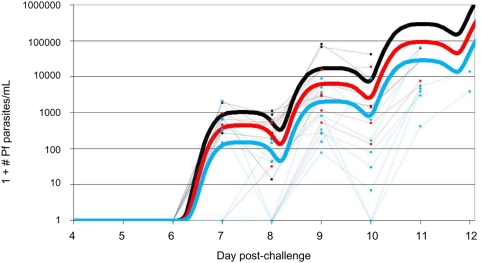
Figure 6. In-vivo growth of blood stage parasites after P. falciparum challenge.
Observed parasite densities of individuals (dots) and predicted kinetics (as a group, thick continuous line) in the three immunization groups experimentally infected with Plasmodium falciparum (3D7). Dots represent observed number of parasites per milliliter of blood based on qPCR results. Individuals in the same group are represented in the same color (Infectivity Controls: black (n = 6), Full dose AMA-1/ASO1B: red (n = 6), Full dose AMA-1/ASO2A: blue (n = 10)). All data points represent pretreatment parasitemias.

