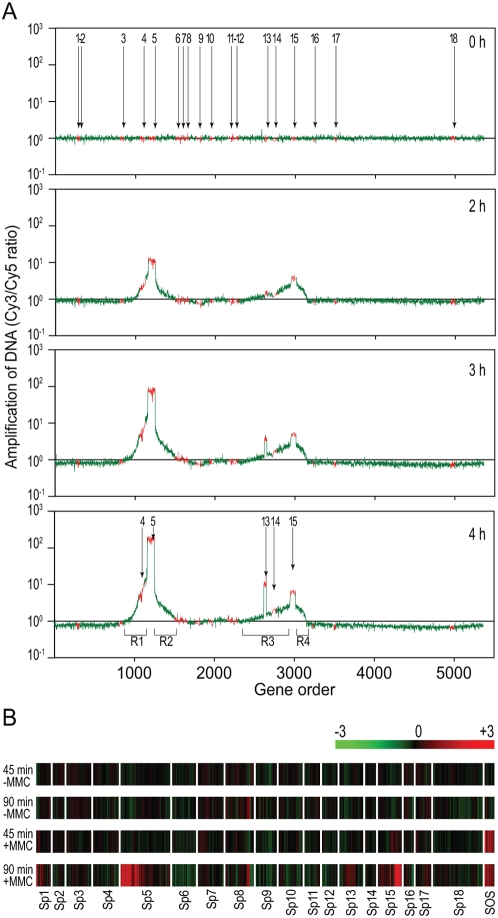
Figure 2. Microarray analysis of the DNA amplification and transcriptional changes of prophages induced by MMC treatment.
(A) Prophage DNA amplification induced by MMC. Total cellular DNA was prepared from O157 Sakai cells treated with MMC and amplification of prophage regions was analyzed using the oligo DNA microarray. Genes on the O157 Sakai chromosome are shown on the x-axes according to their genomic context. The y-axes indicate the ratios of hybridization signals of test DNA preparations relative to that from the reference DNA for the 0-h sample. The test DNA was prepared from the O157 Sakai cells collected at the indicated time points after MMC was added to the culture. The data from the probes representing prophage and backbone genes on the O157 Sakai chromosome are shown in red and green, respectively. All prophage regions (Sp1–Sp18) on the O157 Sakai chromosome are indicated in the 0-h plot, and selectively enriched prophage regions are indicated in the 4-h plot. Chromosome regions amplified by the regional replication of Sp5 and Sp15 (R1 and R2 by Sp5, R3 and R4 by Sp15) are also indicated in the 4-h plot. (B) Transcriptional changes of the prophage genes induced by MMC. The color bar indicates relative expression levels. Total RNA was prepared from the cells collected at the 45-min and the 90-min time points after the addition of MMC. RNA prepared from the cells collected at the 0-min point was used as the reference. RNA prepared from cells left untreated with MMC was also analyzed with the same protocol (−MMC). Only the data for genes in the 18 prophage regions (Sp1–Sp18) are shown according to their genomic context, along with those for the 10 chromosome genes (sulA, dinI, hlyE, umuD, umuC, recX, recA, dinD, lexA, and dinF) that are known to be induced by MMC treatment (SOS) [39],[40]. Average values obtained from two independent experiments are shown. Note that specific probes were unable to be designed for many genes on lambdoid phages because they have nearly identical sequences. These genes were excluded from this analysis.

