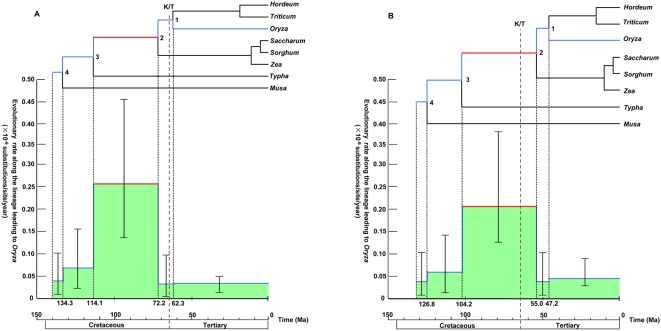
Figure 2. Posterior estimates of divergence times and rate change during evolution.
Estimations were done by using MCMCTREE in PAML [19] with the IR model [15] for the rate change along lineages. Shape and scale parameters, α and β, in the gamma prior for parameter σ2 were 1.0 and 10.0, respectively. Only Poales+Musa part of the whole tree is shown, and a numbering of a node follows that of the whole tree in Fig. 3. The upper lines of the colored area trace the estimated rates along the lineage from the root to Oryza (the lineage indicated by colored lines in the tree) where 95% highest posterior density (HPD) is shown by a vertical line segment with two short horizontal line segments at boundaries. (A) >65 Ma constraint and (B) no constraint to the Zea/Oryza separation (for other calibrations, see Materials and Methods).

