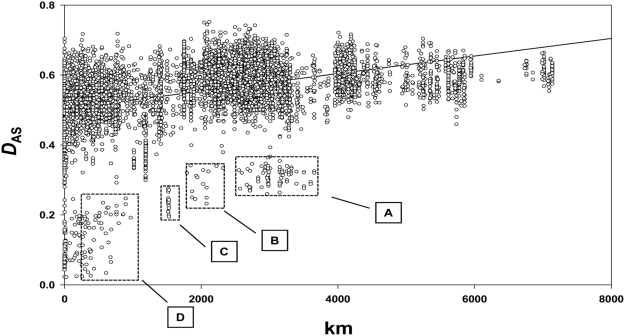
Figure 3. Continental scale spatial genetic structure among 135 TcI isolates from across the Americas.
The graph shows a comparison between genetic (D AS) and geographic (km) distance across the entire dataset. Each data point represents a comparison between two isolates, and there are thus 9,180 in total. A significant positive correlation between these two measures was observed (RXY = 0.394, p<0.0001). Outliers are highlighted by dashed lines. A – VEN dom vs AM North/Cen; B – AM North/Cen vs AM North/Cen; C − ANDES Bol vs ANDES Chile, D – VEN dom vs VEN dom. See text for details of population codes.

