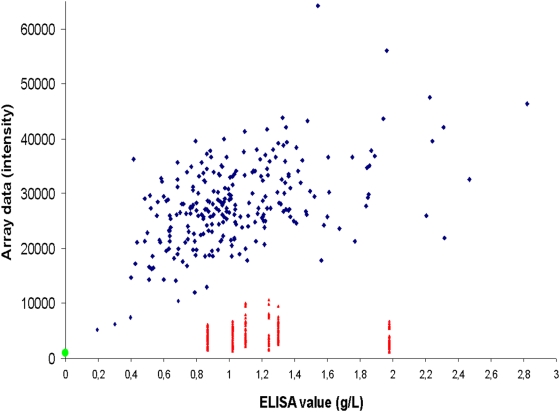
Figure 2. Correlation between serum microarrays and ELISA for C3 levels in DBSS.
The correlation between serum microarray intensities and ELISA values for the Swedish C3 deficient patient (green circle) and 269 controls. Six samples (marked in red) show low intensities on the microarrays when compared to C3 concentration (g/l). The results for the low intensity samples are based on 6 printings and a total of 20–47 replicates.

