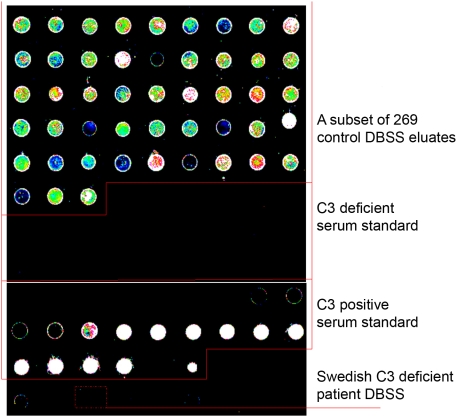
Figure 3. Visualization of the fluorescence intensitites of the microarrays.
The upper part shows a subset of the 269 control DBSS. The Swedish C3 deficient and C3 positive serum standards contains 23 serial dilutions each (high to low dilution, 1∶5 to 1∶100 000). The two lowest dilutions of the standard curve are separated by a blank (PBS). The dotted rectangle depicts the C3 deficient sample.

