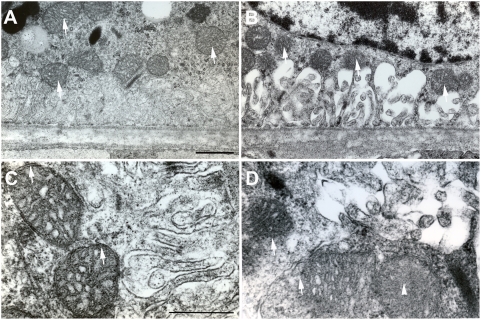
Figure 7. Transmission electron microscopy of the RPE-Bruch's membrane.
A. Control, mice exposed to air (n = 5). This representative micrograph shows that mitochondrial membrane and cristae were well preserved and the matrix has homogeneous electron-dense (arrows). B. Mice exposed to cigarette smoke (n = 5). This representative micrograph shows that mitochondria had lost outer membrane and there was disorganization of cristae (arrows). C. Control, mice exposed to air. This representative micrograph at high power shows intact outer membranes of mitochondria. D. Mice exposed to cigarette smoke. This representative micrograph at high power shows loss of mitochondrial outer membranes (arrows) and disorganization of the cristae (arrowhead). A, B: Scale bar = 1 µm; C, D: scale bar = 500 nm.

