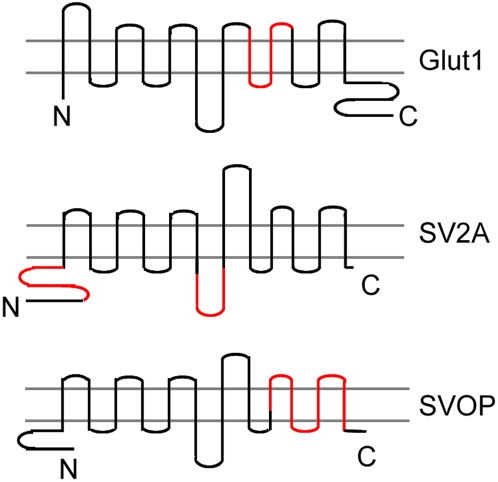
Figure 7. Comparison of the nucleotide binding sites in Glut1, SV2A and SVOP.
Comparison of the nucleotide binding sites in Glut1, SV2A and SVOP suggests convergent evolution of nucleotide binding. Predicted 12 transmembrane domains are depicted. Red lines represent the nucleotide binding domains. The amino and carboxy termini of the proteins are indicated with letter N and C.

