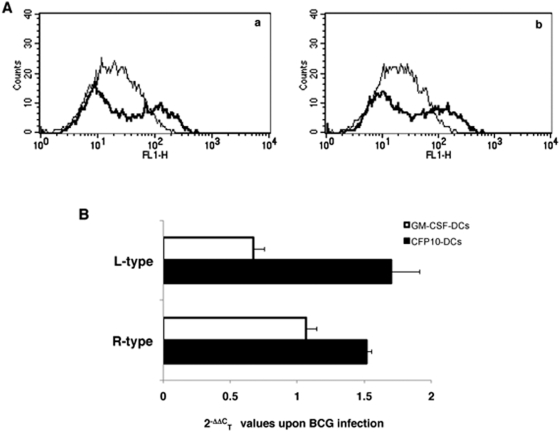
Figure 2. CFP10-DCs express higher levels of L-type and R-type VGCC following BCG infection.
Histograms in Panel A show surface levels of L-type (panel a) and R-type (panel b) in BCG infected CFP10-DCs (thick lines) and BCG infected GM-CSF-DCs (thin lines). Panel B shows, results from qPCR of L-type and R-type VGCC transcripts in BCG infected DCs. The Bars represent 2−ΔΔC T values in BCG infected CFP10-DCs and GM-CSF-DCs. Data are the mean of three independent experiments. Error bars represent mean±S.D. P<0.008 (for L-type levels between CFP10-DCs and GM-CSF-DCs); P<0.02 (for R-type levels between CFP10-DCs and GM-CSF-DCs). Two-tailed Student's t-test was employed for P values.

