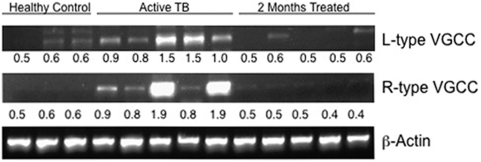
Figure 8. Patients with active TB disease display higher levels of L-type and R-type VGCC.
RT-PCR of L-type and R-type VGCC transcripts in PBMCs from healthy controls, patients with active TB disease and the same patients following 2 months of chemotherapy. β-actin levels are depicted as loading control. For L-type P<0.053 (for healthy vs patients) and for R-type P<0.08 (for patients vs follow-ups). Two-tailed Student's t-test was employed for P values.

