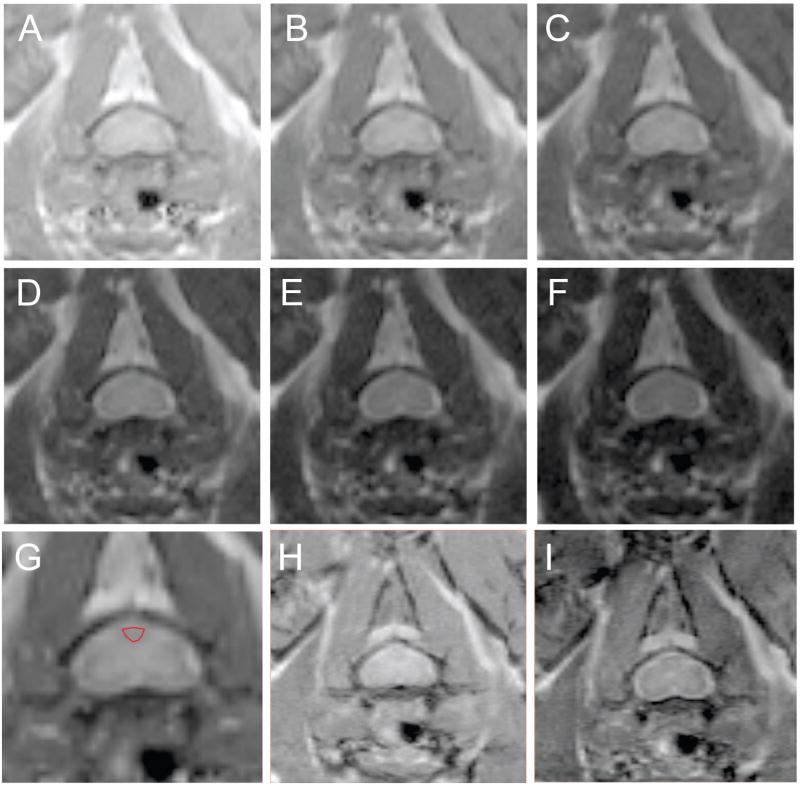
Figure 3. Axial spin echo images of the cervical spinal cord in one mouse.
A sequence of images showing the signal decay over time is shown for TE=5, 15, 25, 35, 45, and 55 ms in A-F, respectively. Delineation between gray and white matter is most easily seen in the 25 ms echo image which has been enlarged in H and the dorsal column is outlined in red. Corresponding images (TR/TE= 4000/15 ms) without and with MT off resonance pulses applied (H) and (I) are shown.

