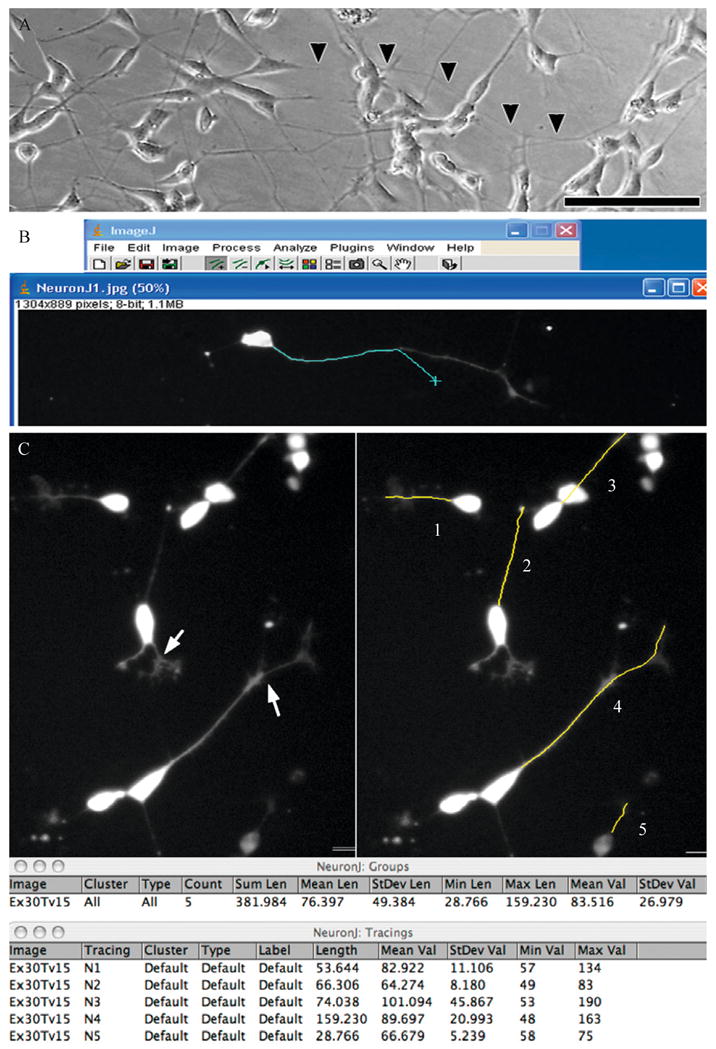
Figure 11.1.

Using the intensity-tracing algorithm in NIH ImageJ. (A) Phase image of differentiated SH-SY5Y cells showing extensive overlap of processes making it difficult to determine the end of a neuritic process (arrowheads) that merges with processes of other cells. Scale: 100 μm. Transfection of RA/BDNF (B) or RA-differentiated (C) cultures with EGFP-C1 allows visualization of the neuritic arbors associated with individual neurons. (B) Using the NeuronJ plug-in for NIH ImageJ, the user clicks at the base of the neurite and as the mouse (cyan X) is moved toward the distal end, the software automatically follows the subtle curves of the structure allowing the user to simply move the mouse to the end of the structure without having to manually trace it. (C) The arrows in the left panel illustrate examples of branch points, and as seen on the right, the user has input in deciding whether to end the measurement at the branch point for primary segment determinations, or select the longer branch to determine the maximal extent of neurite elongation from the soma. As shown in the data table, individual NeuronJ tracings can be grouped to obtain summated and average lengths of all traced neurites in a group. Multiple neurites extending from a single multipolar neuron may be defined as a group to obtain summated neurite lengths per cell (not shown). The software is compatible with both Macintosh and PC operating systems (Panel B: Windows XP running ImageJ 1.36b and NeuronJ 1.1.0; Panel C: MacBook Pro OSX 10.4.11 running ImageJ 1.38X with Java 1.5.0_13 and NeuronJ 1.2.0).
