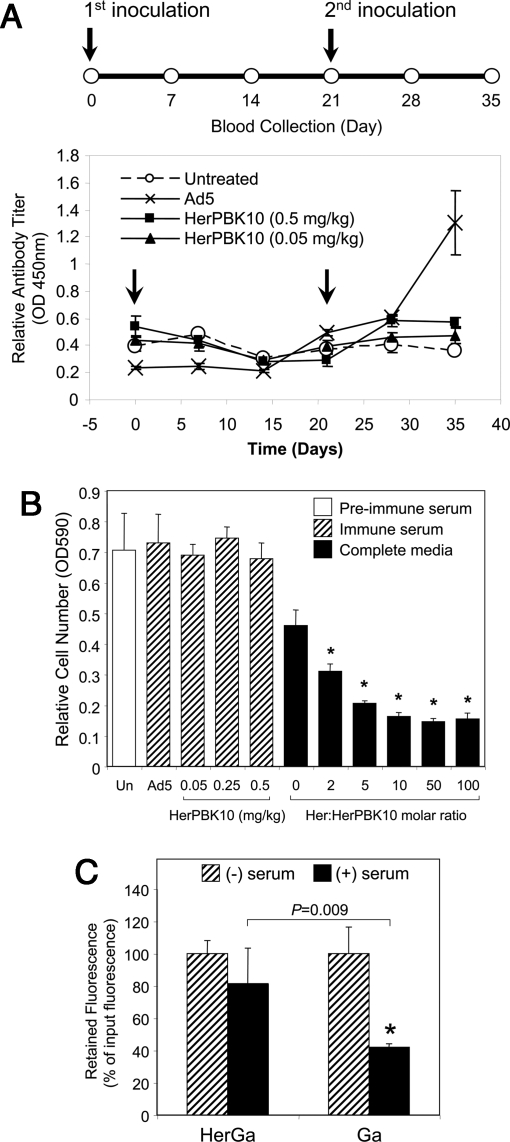
Fig. 4.
Neutralizing antibody induction and serum stability. (A) Immunocompetent (C57BL/6) mice received an initial s.c. inoculation of HerPBK10 protein (0.05 or 0.5 mg/kg) or Ad5-GFP (1.2 × 10⁹ pfu per mouse) followed by blood collection scheduled every 7 days up to day 35 after the initial inoculation as summarized by the time chart (Upper). On day 21, respective mice received a second inoculation of each corresponding reagent. Sera isolated from bleeds were assessed by ELISA for relative antibody titer produced against HerPBK10 (Lower). Arrows denote days of antigen inoculation. n = 4 mice per treatment group dose. (B) Effect of immune sera on target cell binding. Ligand-receptor binding was tested by measuring the level of cell attachment to HerPBK10-coated plates in immune or preimmune serum collected from mice in A. Cells suspended in either preimmune serum, immune serum from Ad5 or HerPBK10-inoculated mice, or complete media containing 10% bovine serum but no mouse serum were incubated on HerPBK10-coated wells for 1 hr at 37 °C, followed by removal of free cells and measurement of attached cells by crystal violet assay. The level of receptor-specific binding was assessed on separate cells preincubated with competitive inhibitor (Her). Un, untreated mice. *, P <0.01 compared with cells attached in preimmune serum, as determined by the 2-tailed unpaired t test. (C) Relative corrole retention by HerGa during incubation in human serum. Human serum (Omega Scientific, Inc.) was immobilized by overnight incubation at 4 °C in 96-well plates. The next day, the wells were washed with PBS, and HerGa or S2Ga alone (50 μM final) were added to each well. After incubation at 37 °C for the indicated time points, samples were removed from the wells and measured for corrole fluorescence. Corrole retention or loss by the complex was assessed by comparing the fluorescence of preserum and postserum incubation samples (RFU 424 nm excitation wavelength/620 nm emission wavelength of postincubation sample/input). Fluorescence values are shown as a percentage of input fluorescence (of fluorescence of complex before serum incubation). *, P <0.03 compared with incubation without serum. Significances were determined by 2-tailed paired t tests.

