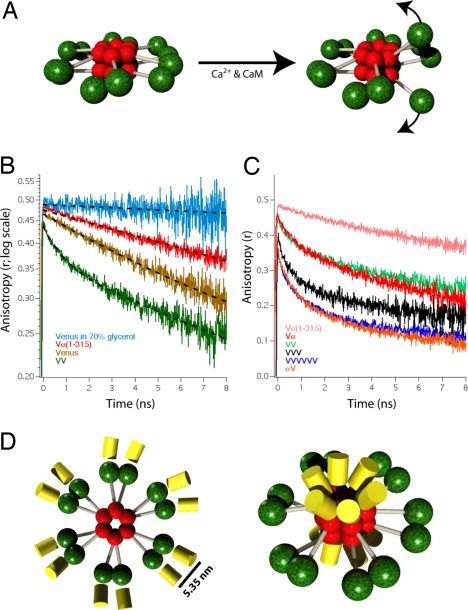
Fig. 1.
Time-resolved fluorescence anisotropy of Venus-tagged CaMKIIα. (A) Model for the holoenzyme structure before and after activation of one of its six pairs of catalytic domains is depicted. Red spheres indicate association domains, green spheres indicate catalytic domains with regulatory and variable domains depicted as gray cylinders. (B) Fluorescence anisotropy decay curves of HeLa cells expressing Vα(1–315), Venus, and VV (a concatamer of 2 Venus molecules). Each curve is an average of five traces from five cells. A decay curve of Venus in 70% glycerol is also depicted (n = 2). Dashed lines are single-exponential curve fits except for the VV construct where a double-exponential model was used. (C) Fluorescence anisotropy decay curves of Vα and αV are plotted with decay curves of VV (from B), VVVVVV (a concatamer of six Venus molecules), and Vα(1–315) (from B). Each curve is an average of five traces. (D) Diagram depicting the autoinhibited CaMKIIα holoenzyme model with Venus attached either to the N terminus (Left) or C terminus (Right) that are consistent with the Vα and αV anisotropy decay curves.

