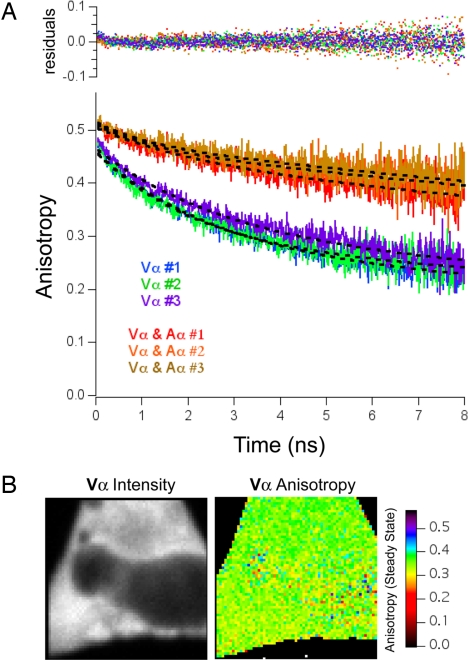
Fig. 2.
Global fitting of Venus–CaMKIIα anisotropy decay curves. (A) Anisotropy decay curve of cells expressing Vα alone (blue, green, and purple traces) or Vα coexpressed with an excess of Amber–CaMKIIα (Vα and Aα; red, orange, and yellow traces). The transfection ratio used was 1:6, and each trace is an average of anisotropy measurements from five cells. Dashed lines are the results of a global fit to a double-exponential model. Global fitting was performed by using the following equation: r(t) = r1·e(−t/ϕ) + r2·e(−t/θ), where the rotational correlation time (θ) was linked between all six curves, and the limiting anisotropy (r0) is equal to r1+ r2. Residuals are plotted on the Top. (B) Intensity and steady-state anisotropy images of Vα expressed in HeLa cells.

