Fig. 3.
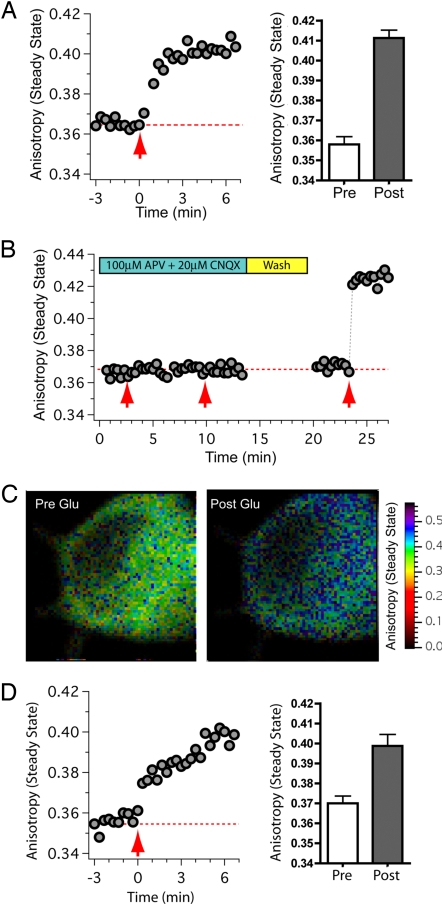
Activation of CaMKIIα initiates catalytic dimer separation. (A) Time course of anisotropy values acquired from somas of hippocampal neurons expressing Vα. Glutamate and glycine were applied at time = 0 (red arrow). Bar graph shows the ensemble steady-state anisotropy values before (Pre; mean ± SD, n = 10 cells) and after stimulation (Post; n = 8 cells). (B) Time course of anisotropy values acquired from neurons expressing Vα in the presence of APV and CNQX as indicated. The first and second red arrows indicate the times at which glutamate/glycine (with APV and CNQX) was applied. Subsequently, the chamber was washed with PBS and challenged with agonist again in the absence of APV and CNQX (indicated by the third red arrow). (C) Intensity-weighted steady-state anisotropy images of the neuronal soma in B before and just after the third application of glutamate/glycine. (D) Time course of anisotropy values acquired from neurons expressing Vα(T286A). Glutamate and glycine were applied at time = 0 (red arrow). Bar graph shows the ensemble steady-state anisotropy values before (Pre; mean ± SD, n = 9 cells) and after stimulation (Post; n = 8 cells).

