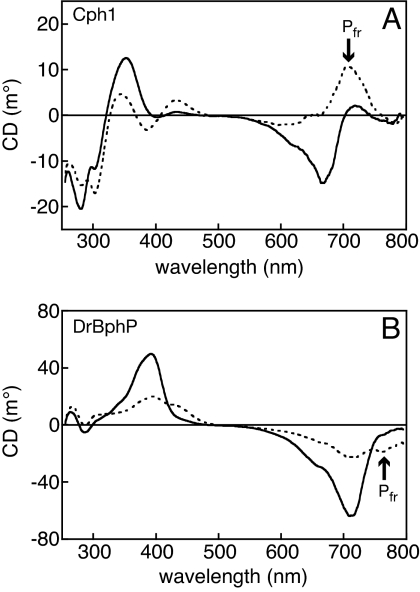
Fig. 1.
The Pfr states of Cph1 and DrBphP are distinct. (A) CD spectra of 21 μM Cph1 in the Pr state (solid line) and at Pr/Pfr photoequilibrium (dashed line). (B) CD spectra of 17 μM DrBphP in the Pr state (solid line) and at Pr/Pfr photoequilibrium (dashed line). The far-red absorbance of Pfr is indicated.

